Exploration
-
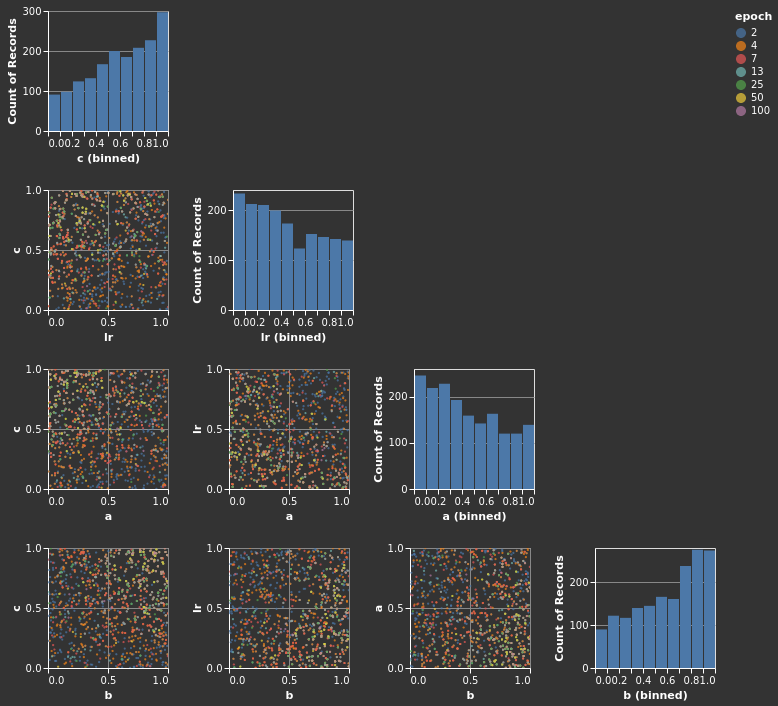
olympus.dashboard.plots.hyperparameter_exploration.scatter_matrix_altair(configs, columns, color='epoch')[source]¶ Plots hyper-parameter space exploration
Parameters: - configs: List[dict]
A list of configuration tried by the hyper-parameter
- columns: List[str]
A list of the hyper-parameters
- color: str
Dimension to use to color each points
Examples
>>> columns = ['a', 'b', 'c']
>>> data = [
...     dict(a=1, b=2, c=3, epoch=1),
...        dict(a=2, b=1, c=1, epoch=2),
...        dict(a=3, b=3, c=2, epoch=3),
... ]
>>> chart = scatter_matrix_altair(data, columns, color='epoch')
-
olympus.dashboard.plots.hyperparameter_exploration.scatter_matrix_plotly(data, columns)[source]¶ Examples
>>> columns = ['a', 'b', 'c']
>>> data = [
...     dict(a=1, b=2, c=3, epoch=1),
...        dict(a=2, b=1, c=1, epoch=2),
...        dict(a=3, b=3, c=2, epoch=3),
... ]
>>> chart = scatter_matrix_plotly(data, columns)